S&P Long and Medium Term Outlook

A favorite discussion the internet often likes to do is to debate whether we are in cycle, supercycle or grand supercycle degree in Elliott waveterms. Honestly for the immediate life of most of us it matters less, unless we plan to live over 150 years!


For those not familiar with Elliott wave terms, the basic idea that growth or demise happens in 5 waves, with waves 1,3, and 5 are in the direction of the trend and are called actionary waves, and waves 2 and 4 are counter-trend or corrective waves. The pattern is fractal meaning whether you zoom in or out, the pattern is repeating itself at every level. Whenever a 1, 2, 3, 4, 5 structure is completed, it would consist an actionary wave of a larger degree and what follows is a correction at that higher level that unfolds on in corrective patterns.

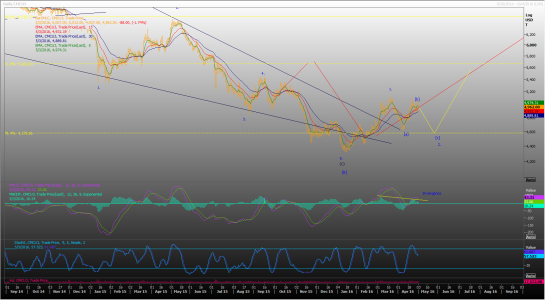
That said, the analysis drawn is based on the idea that we are in a wave 3 supercycle degree that started in July 2010, after wave1 supercycle degree started in March 2009, and wave 2 supercycle degree ended in July 2010. Since Feb 2016 we are in wave 5 cycle degree that would complete the wave 3 supercycle degree and open way for wave 4 supercycle degree. Within the wave 5 cycle degree we have just completed wave 3 at primary degree, and witnessed the start of wave 4 at primary degree that would last for a good time ahead before opening way for wave 5 primary degree leading to all new highs to conclude wave 3 supercycle degree and lead us to wave 4 supercycle degree. What we are witnessing now, that could well last for a good chunk of 2019 and could extend in 2020, is setting ground for a good last short term run in growth (wave 5 primary degree), before another bumpy correction. What I am saying it is a rough ride ahead with lots of ups and downs.

In later posts, I will note short term possible set-ups that could be of interest, however environments of wave 4 are usually hardest to trade, as there is lots of indecision and wild volatile moves. Zooming on short term level, once could still find opportunities to ride short term trends.


S&P Weekly Count

S&PWeekly01112018

S&P Daily Count

S&Pdailyy01112018


Medium Term Outlook on Dubai Financial Market General Index

On October 2015, I had presented a scenario which depicts an ongoing correction since the top in 2014.  During that post, I indicated that the DFMGI is undergoing what is known under Elliott Wave terms as a double Zig Zag.  The count, I present today does maintain the same view, with the count now near completion.

The duration of the correction  has gone beyond what was expected, considering the expectations for Oil and commodities in general was to start a rally by 2016, I refer to the post on 26th October, 2015 “Long Term Outlook on USD”, and subsequent posts on metals in Q2 2016 calling for early phase of a new uptrend in metals.

The DMFGI did join the start of the Oil rally in 2016, however it turned out to be just a continuation of the Zig Zag correction forecasted. Today, we are at the very last stages of that correction and we should be soon in accumulation phase for a new uptrend that is at least equal to the rally that took place between 2012 and 2014. That said, there is an alternate scenario which I am not presenting today, that would see the correction prolonged for at least another year or two. In this alternate scenario the index would still rally in 2019 but fails to break 3740 and and reverts lower in one last leg of of decline. This short term scenario would be looked into, judging how the rally in 2019 will look like. Should the rally in 2019 break 3740 to the upside then below count will be confirmed.

On short term, we can yet expect for one more small push lower which would then conclude the pattern or alternatively we would get a small correction upwards to 2900-3000 levels over next months extending into January 2019 when prices would then revert lower for one last push into lows of 2400 +/-, which is the scenario considered below. In either case we are looking at a sizable move upwards to start in Q1 2019.

For the time present, I would be looking for confirmations to indicate that an uptrend has started. We have early soft confirmation with the MACD divergence, but we would also require confirming price action which so far is absent.

Below I present the weekly and daily counts with potential price target zone over the next few months if presented scenario proves right.

DFMGI Weekly Count

DFMGIWeekly21102018


DFMGI Daily Count


DFMGIDaily21102018


Medium Term Outlook LME Copper, May 3rd 2016

Revisiting the analysis published on Oct. 19th 2015, copper was expected to make new lows into the new year and thereafter rebound putting an end to the downtrend it has been going through since 2011. An exhausting long 5 years journey of little hope and lots of disappointment. In the charts below red line shows the expected path as drawn in 2015, clearly the forecast was not bearish enough on the short term, as price fell directly into target zone shortly after.

Here we are in 2016 and it seems so far that the call made 6 months ago is translating into reality. Again being in early stages of a trend, things are always open to sudden changes. In Copper key level as of now stands at the Jan 2016 low 4318. In the near term, price is expected to drift lower, however it should not break below 4318. In below charts the possible path identified in yellow lines. In a more bullish scenario price might hold above 4631. A break through 5438 would add a confirmation of an established uptrend. As long as price is trading below that figure, an alternate bearish scenario would call for another dip in prices later in 2016. As of now, we keep that on plan “b” basis and it would come into play only if price breaks 4318 to the downside.

Copper Weekly

copperweekly05032016

Copper Daily

Copperdaily03052016

Medium Term Outlook Nickel, May 2nd 2016

In last article dating slightly over 6 months, it was forewarned that the downtrend might carry into early 2016 but not much beyond.  Now in 2016, here we are having seen the worst and prices are on the rise. Every dip is being bought which indicates a change in the sentiment towards a more bullish outlook. The worst news was happening in Dec 2015 and early 2016 on fundamental side, which only added to my conviction that the trend is wrapping up. Now stories started to look different in the news. It is sometimes amusing to observe how news fits the price action and really tell you nothing more than what you can already see in the price. News should be called olds as there is really nothing new about news.

Below is an updated chart on Nickel showing the downtrend sequence as complete and over (lines in red are the line drawn 6 months ago indicating future direction). The new uptrend is still shaky and fragile. So while a bullish view is favored, any sudden changes can reverse our short term outlook. However as long as key levels are held, the new baby bull is safe. The key level in Nickel for now is 8240, any break below that level would negate the immediate price rise. On the positive side, any price acceleration beyond 10700 would confirm the trend change to more bullish outlook that could take prices to 30000 and beyond in couple years to come. On the daily chart, the yellow lines indicate the possible price path over the month of May and sebsquent months. Again, the bullish view remains intact ONLY if 8240 is not broken to the downside.

Nickel Weekly Count

Nickelweekly020516

Nickel Daily Count

NickelDaily020516

Medium Term Outlook on Dubai Financial Market General Index

Dubai Financial Market General Index has undergone a remarkable run up to 2005 into highs of 8544 and has ever since not seen these numbers even at the heights of the property bubble during 2007/2008. While the index crashed along international equity markets, however it didn’t manage to stage a recovery post 2009 as the S&P did. Only in Jan 2012, did the index hit bottom at 1294 and rallied slightly over 400% into 5425 in May 2014 which so far remains unchallenged.

I will start off by saying considering the price action from 2005 into the lows of 2012 and then subsequent rally, I am Medium Term (few years) bullish, while long term is yet to be seen as I lack enough data to judge the outlook. In any case, once the ongoing correction since May 2014 is confirmed as done, I would expect another move that is at least the size of the run from 2012 into 2014.

The market however may take several paths and variations on short term. In the view presented below, it depicts that the index has been undergoing a complex correction known under Elliott Wave terms as double Zig Zag, which indicates further weakness ahead into the months to come. This view is confirmed as soon as price breaks 3241.35 to the downside. This is the preferred count especially considering the expected weakness in Oil prices. Further several technical indicators are pointing to further weakness on short term which most likely will lead to breaking the level of 3241.35. The alternative count is given lower priority at this stage and would come into play only if price does manage to hold above 3241.35 and we see price rallying back above 3739 into the zone of 3900 +/-. Only a decisive close above 4253.28 would confirm a multi months advance has been established.

Below I present the weekly and daily counts with potential price target zone over the next few months if presented scenario proves right.

DFMGI Weekly Count

DFMGIWeekly


DFMGI Daily Count


DFMGIDaily


Long Term Outlook on USD Index

In the two charts below, is the long term outlook on the USD presented. The USD has seen a remarkable run over a period of about 9 months. That has pushed several currencies of developing economies lower which only added pressure to international commodity trade that has already been suffering for several years. The Good news is that usually after such a run, whatever the instrument it is, what follows is a last swing before the trend reverses.

Below I present my preferred count. The alternative count is not much different, however it would indicate that the top is already in place at 100.390 on March 13th, 2015. However, judging on the price action after that point, I am tending towards having one more swing higher that will push the Dollar Index beyond 100.390 putting further pressure on developing currencies and possibly commodities.

As discussed in the last post, relation between USD Index and commodities is by no means linear, however considering the overall fundamentals and general sentiment of the market, I would view that any news on strengthening USD will push traders to sell commodities. A relation that probably will be best displayed in Oil prices in the near term future!

Before I present the chart, I can only say, hold your seats and brace for impact, who survives will be seeing better days soon. 🙂

USD Index Weekly Count

USDWeekly

USD Index Daily Count

USDDaily